
In This Article
What changed, and does it matter? When you check the stock market today, an index’s gain tells you where it finished, but not why it moved or whether most stocks joined in.
A useful daily update connects prices to verified events and separates those events from investors’ interpretations. Start with the latest confirmed index levels. From there, rates, economic data, company news, and oil can help explain the day’s action without turning one session into a trading signal.
Key Takeaways
- The latest verified figures here are closing levels from Monday, September 21, 2026, not live prices for September 22.
- Technology and chip-stock strength featured in reports about Monday’s rally, but one explanation cannot account for every trade.
- Check bond yields, oil, and the mix of rising and falling stocks before drawing conclusions from an index.
Stock Market Today: Start With the Indexes, Then Find the Driver

The latest confirmed U.S. closing snapshot
The figures below are for the regular-session close on Monday, September 21, 2026, at 4 p.m. Eastern Time. They are not futures quotes or September 22 intraday prices.
| U.S. index | Closing level | Point change | Percentage change |
|---|---|---|---|
| Dow Jones Industrial Average | 52,048.83 | +366.19 | +0.71% |
| S&P 500 | 7,764.70 | +114.20 | +1.49% |
| Nasdaq Composite | 27,122.09 | +599.55 | +2.26% |
The Nasdaq’s larger percentage gain points toward strength in growth-oriented shares, especially technology. Yet the table alone cannot show how many stocks rose or whether a few heavily weighted companies supplied most of the gain. The Dow, S&P 500, and Nasdaq measure different groups of stocks, so their moves needn’t match.
Check Treasury yields, oil, and the dollar alongside stocks.
Separate market snapshots placed the U.S. 10-year Treasury yield above 4.93%, with reported readings as high as 4.972%. Those readings are not a verified yield at the same moment as the stock market close, so they should not be treated as a synchronized comparison. The Federal Reserve’s daily interest-rate release offers a dated reference when checking yields.
Reports also described falling oil prices during Monday’s rally. Lower oil can ease some inflation concerns, while higher Treasury yields can make borrowing costlier and reduce the appeal of shares valued on distant profits. A stronger dollar can affect companies with overseas revenue. Each is a clue, not an automatic explanation for stocks’ direction.

What Is Moving Markets: Rates, Data, Earnings, and Global News
Separate the event from the explanation.
The confirmed event on September 21 was a strong U.S. stock-market close, led by the Nasdaq’s 2.26% gain. Market coverage described renewed enthusiasm for artificial intelligence and strength in technology and chip shares. That is a reported interpretation of trading, not proof that every investor bought for the same reason.
A practical daily update ranks the strongest evidence first: an official economic release, a Federal Reserve announcement, a company filing, or an observable move in oil or bonds. Commentary about investor mood comes afterward. Several forces can operate at once, and the dominant story can change before the closing bell.
Watch the calendar, then check the result.
Scheduled news matters because traders may adjust positions ahead of it. But a calendar entry is not a data result or a policy decision. The New York Fed’s economic indicators calendar lists release dates and times in Eastern Time, which helps readers distinguish an upcoming report from one already published.
Likewise, stock futures trade outside the regular cash-market session. A premarket rise may change direction once U.S. stocks open. Always check the timestamp and whether a quoted move refers to futures, intraday trading, or an official close.
How Fed Decisions and Economic Reports Change Rate Expectations
Inflation and job reports affect the path investors expect.
The Federal Reserve sets a target range for the federal funds rate. Investors, meanwhile, trade on expectations about where policy may go next. A hotter-than-expected inflation report may raise concerns that rates will stay higher for longer. A weaker report may ease those concerns, though its effect depends on what markets had already expected.
For inflation, check the release itself rather than a headline stripped of context. The Bureau of Labor Statistics publishes Consumer Price Index data with details that help distinguish the monthly change from the change over a year. Those are different measures, and either can move bond prices when it surprises investors.
Jobs data adds another piece. Strong hiring can point to steady demand, while a softer report may raise worries about growth. Wages, unemployment, and revisions to earlier figures also matter. Finance Beacon’s explanation of how the jobs report moves markets shows why the headline payroll number rarely settles the whole question.
Follow the yield, but mind its timestamp.
Bond yields often move as rate expectations shift. When Treasury prices fall, their yields rise. Higher yields can put pressure on stocks, particularly companies whose expected profits lie far in the future. Still, stocks and yields can rise together if investors see stronger economic growth.
Before drawing that connection for a particular day, compare observations from the same period. The U.S. Treasury’s daily yield curve rates provide dated figures; an early yield quote and a late stock close can tell different stories.
Which Companies and Sectors Are Leading or Lagging?
Technology strength does not establish broad participation.
Monday’s Nasdaq gain fits reports of strength in technology and chip stocks. It fails to establish that most Nasdaq shares rose. The S&P 500 is weighted by market value, so larger companies have more influence on its level than smaller members.
That distinction matters when a headline says “stocks climbed.” An investor who owns a broad fund may see gains, while holdings concentrated in another sector finish lower. To judge participation, compare sector performance and the number of advancing stocks with declining stocks. The index closing figures alone do not establish either measure.
No verified company-specific closing moves are available for this session in the information reported here. Naming a particular chipmaker as Monday’s leader, or assigning a gain to its earnings, would overstate the evidence.

- TAKE CONTROL OF YOUR MONEY & ACHIEVE YOUR FINANCIAL GOALS – Are you looking for the best monthly budget planner to keep …
- FIND THE BEST WAY TO ACHIEVE YOUR FINANCIAL GOALS – This budget organizer is not just a tool; it’s a framework for achie…
- EASILY CONTROL YOUR SPENDING, DEBTS & SAVINGS – This money planner is undated and covers 12 months. Every month features…
Put earnings surprises in context.
Company results can move both a stock and its peers, especially when management changes its sales forecast or spending plans. The useful comparison is usually the result against expectations, not simply whether profit increased.
For a large index member, also ask how much of the index move came from that one stock. For a smaller company, a sharp share-price swing may barely affect the benchmark. Sector performance can help bridconnect an individual earnings story to wider market.
When Oil Prices or World Events Shift Investor Mood
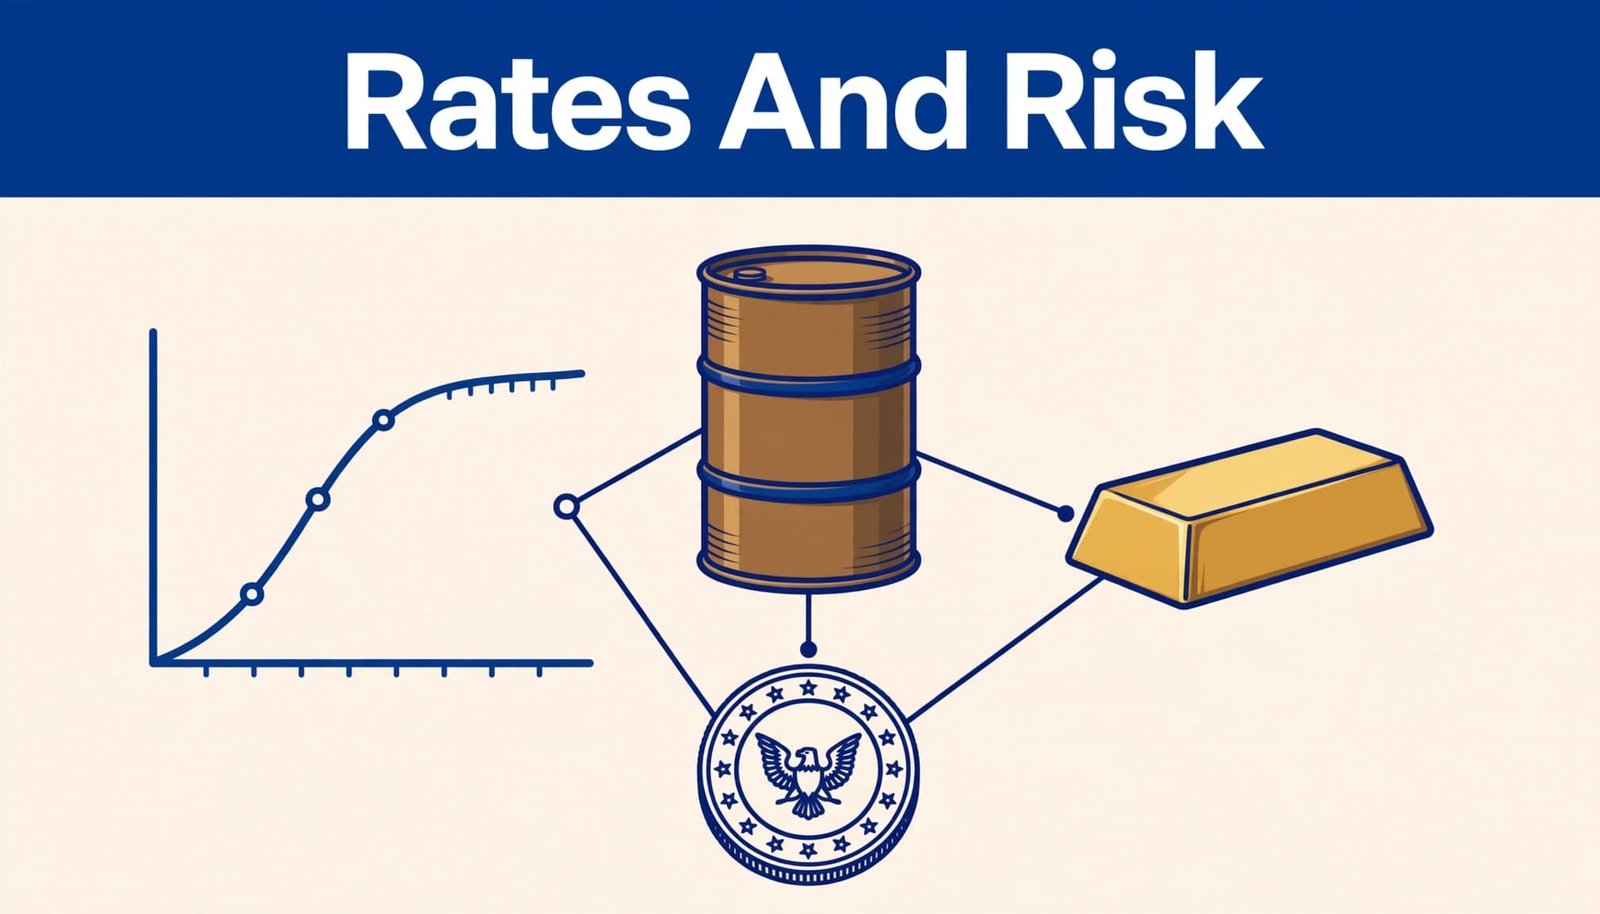
Falling oil can help some stocks and hurt others.
Separate reports put Brent crude near $100 a barrel, down about 3.7%, and U.S. benchmark WTI near $95.50, down about 4.8%. These oil readings were not verified at the same timestamp as the September 21 index closes. They support the reported direction of oil’s move, not a precise side-by-side closing comparison.
Oil feeds into fuel and transportation costs, so a sustained price drop can ease some pressure on consumers and businesses. Energy producers, however, may face lower revenue when crude falls. The stock-market effect depends on why oil moved: improved supply prospects tell a different story from weakening demand.
Trace world news through prices, not assumptions.
An overseas conflict or supply disruption can raise concern about crude shipments. If oil climbs, investors may revisit inflation expectations; bond yields and stocks may then react. Each step needs evidence. A geopolitical headline alone cannot confirm that oil, inflation expectations, and shares all moved for the same reason.
Overseas stock markets can add context, too, but their trading hours differ. An Asian close, a European midday price, and a U.S. close are snapshots taken at different times. Check that sequence before calling the moves a single global reaction.
How to Read the Market Move Without Overreacting
Look beyond the headline index number.
Begin with the percentage change, not the point change. A 300-point Dow move means something different at 52,000 than it did when the index was much lower. Then check whether other major indexes moved in the same direction.
Next, look at market breadth, sector returns, and trading volume. Broad participation gives a different picture from a rally confined to a few large shares. Volume can show how much trading accompanied a move, but high volume alone does not tell you whether buyers or sellers will prevail tomorrow.
Finally, compare stocks with Treasury yields and oil. Mixed moves aren’t necessarily contradictory. Investors may welcome cheaper energy while worrying about interest rates or buy chip stocks while selling another sector. A daily market report is most useful when it leaves room for those competing forces.
Match market news to your time horizon and risk comfort.
One strong session does not establish a lasting uptrend. Neither does one decline prove that a long-term investment plan has failed. Check a move against a longer period, then consider whether the news changes the reason you own an investment.
Money needed soon has less time to recover from a loss than money set aside for a distant goal. Your ability to withstand a decline also matters, as does how concentrated your holdings are. Finance Beacon’s guide to risk tolerance and time horizon puts those questions within a broader financial plan.
Daily coverage supplies context, not a personal instruction to buy or sell. Before acting, verify current prices and consider your own goals, finances, and capacity for loss.
Common Questions About the Stock Market Today
Why can the Nasdaq rise more than the Dow?
The indexes hold different stocks and use different weighting methods. Technology shares have a strong influence on the Nasdaq Composite, while the Dow tracks 30 large companies and weights them by share price. A technology-led session can therefore produce different percentage gains.
Does a higher Treasury yield always mean stocks will fall?
No. Higher yields can weigh on stock valuations, but the reason yields rose matters. If investors expect stronger growth, shares may rise alongside yields. Compare the timing of both moves before linking them.
Why do market reports mention futures before stocks open?
Futures provide an early indication of where an index may open. They trade outside regular U.S. stock-market hours, so a futures move is not the day’s official index change. News or trading after the open can reverse it.
Can one day’s rally confirm that a market decline is over?
No single session settles a longer trend. Compare several weeks or months of prices, along with breadth and the news driving them. Even a broad rally can reverse when new information arrives.
The Bottom Line
When markets swing, the useful question remains: what changed, and does it matter? Understanding the stock market today means checking confirmed index levels, then weighing rates, economic news, company results, and wider events against them.
Verify the date and session behind each figure. Find the strongest supported catalyst, and keep a single day’s move in proportion to your longer-term goals.
Conclusion: Understanding What Moves the Stock Market Today
Understanding the stock market today requires looking beyond headline index gains and losses. Interest rates, inflation reports, employment data, corporate earnings, oil prices, and global events all influence market movements. Examining these factors together helps you understand why stocks rise or fall.
The September 21, 2026, rally highlighted strength in technology shares, but a single trading session does not establish a lasting market trend. Before making investment decisions, check verified market data, compare sector performance, and consider how economic developments affect your holdings.
Successful investing requires informed decisions, patience, and a clear understanding of your financial goals and risk tolerance. Rather than reacting to every market headline, focus on maintaining a diversified portfolio and following an investment strategy aligned with your long-term objectives.