In This Article
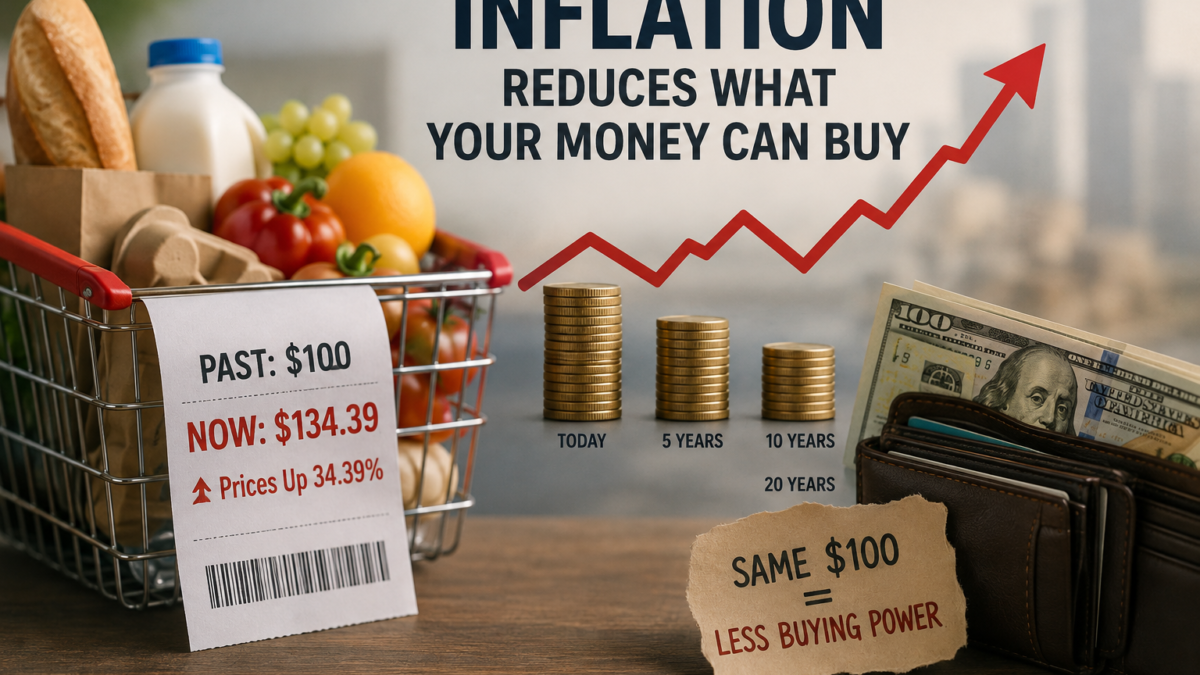
A grocery bill that once cost $100 can now take a larger bite from your paycheck, even if your income hasn’t changed. This is inflation and purchasing power in everyday life: inflation is a broad rise in prices, while purchasing power is what your money can buy. When prices climb, each dollar buys fewer goods and services. The U.S. Bureau of Labor Statistics uses the consumer price index (CPI) to track price changes across a representative basket of consumer expenses. Its data helps show the inflation rate and how a dollar’s buying power changes over time.
That loss affects more than groceries and coffee. It can raise household costs, weaken the real value of wages and savings, change the burden of debt, shape borrowing costs, and affect investment returns. This guide will explain how to compare nominal dollars with their real value, then connect inflation to your personal finance basics, monthly spending plan, emergency savings, and long-term financial decisions. Next, we’ll look at how CPI measures inflation and why the numbers on your budget may feel different from the national average.
What Inflation Means for the Value of Your Money
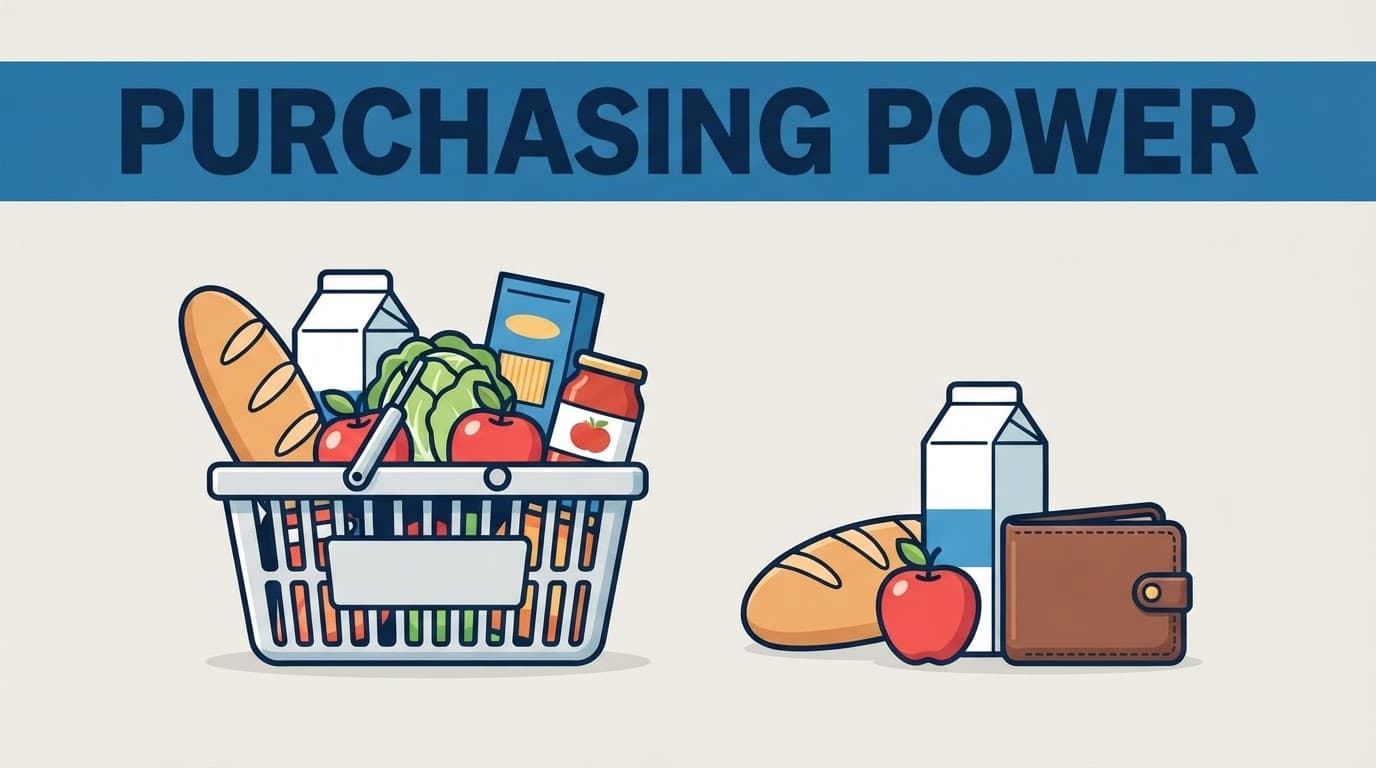
Inflation reduces the value of money by raising the amount you must pay for the same goods and services. Your account balance may stay unchanged, but its purchasing power, or what that money can buy, declines over time.
Purchasing Power Falls When Prices Rise
Suppose $100 buys a week of basic groceries today. If those groceries become pricier, that same $100 may cover only part of the basket later. You still have 100 dollars in your wallet, but each dollar carries less buying power.
Even moderate inflation compounds. Prices rise on top of earlier price increases, much like a small snowball growing as it rolls downhill. This illustration assumes an inflation rate of 3% every year:
- $100 today would have the buying power of about $74.41 after 10 years.
- An item costing $100 today would cost about $134.39 after 10 years.
The calculation uses compound growth. To estimate the future price, multiply $100 by 10 years 1.03for each year. To estimate what $100 will buy later, divide by the same factor, or $100 / 1.03^10. The result is an illustration, not a forecast, because the actual inflation rate changes from year to year.
A growing money supply can put upward pressure on prices when it expands faster than the economy’s output. A central bank monitors this relationship when evaluating economic conditions. The quantity theory of money is one framework for connecting the money supply, prices, and output.
That framework simplifies the relationship because real-world spending and production can change in different ways. The central bank considers these factors when assessing how prices may affect your cost of living.
The BLS CPI Inflation Calculator uses historical data from the consumer price index to compare the buying power of dollars across different years. This helps you separate the number printed on a bill from what that amount can actually purchase.
Inflation Is Not the Same for Every Household
The published inflation rate is an average based on a representative basket of consumer expenses. Your household has its spending pattern, so your personal inflation rate may be higher or lower.
A renter may feel housing increases more sharply than a homeowner with a fixed-rate mortgage. A commuter may notice fuel, repairs, and public transportation costs first, while a retiree may spend more on health care. Families with children can face a different mix of food, child care, and education expenses.
Prices also move at different speeds. Food, housing, energy, transportation, health care, and education don’t all rise together. If your largest expenses increase faster than the overall average, your budget may feel strained even when the headline rate seems manageable. That gap is why tracking your spending gives you a clearer picture of how inflation affects your daily life.
How Inflation Affects Household Finances
Inflation reaches nearly every part of a household budget. As prices rise, you must view your paycheck, savings, and debt payments in terms of their purchasing power, not just the dollar amounts shown on paper.
Household Expenses Take More of Your Paycheck
Groceries, rent, utilities, transportation, insurance, health care, and other services can all become pricier during inflation. If your monthly income stays the same, essential bills consume a larger share of it. The BLS Consumer Price Index data tracks these price movements across major spending categories and helps show how the inflation rate affects households.
The producer price index can provide an earlier upstream signal when higher business input costs eventually reach consumers. These production pressures may affect the prices of food, transportation, housing, and other essentials.
A higher grocery bill doesn’t always mean your family bought more food. If the same basket costs $150 instead of $135, prices increased even though your purchasing habits stayed unchanged. That distinction matters when reviewing your budget.
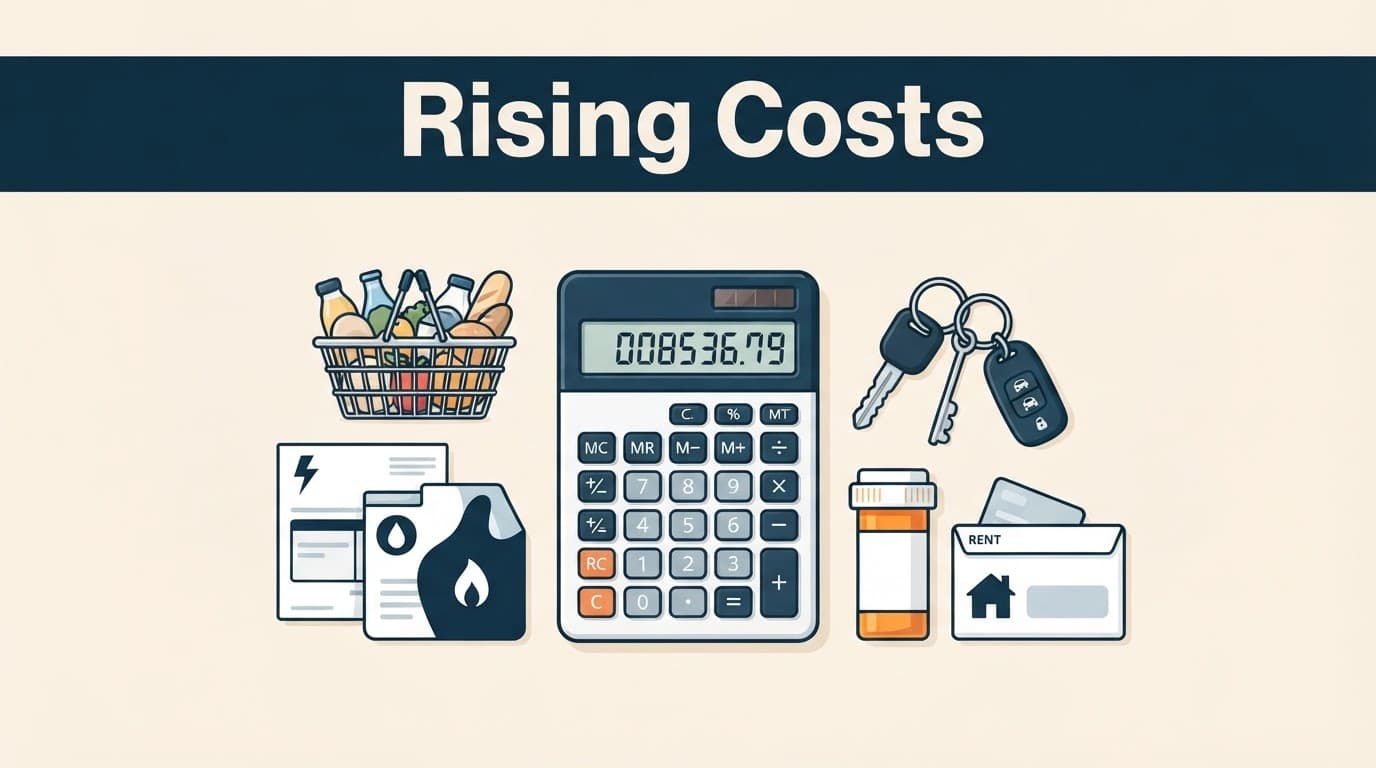
Families may respond by switching brands, delaying purchases, reducing restaurant meals, or cutting entertainment. However, essential costs are often difficult to reduce quickly. You may be able to buy fewer snacks, but you still need housing, electricity, transportation, medical care, and basic food.
A monthly budgeting guide can help you separate fixed bills from flexible spending. That view makes it easier to decide which costs you can adjust without treating every expense as equally changeable.
Wages May Rise, but Real Income Tells the Full Story
Real income is your earnings after adjusting for inflation. A raise increases your nominal income, which is the dollar amount on your paycheck, but your real income depends on how quickly prices rise.
For example, suppose your salary increases by 4% while the inflation rate reaches 5%. Your paycheck is larger, yet your purchasing power falls by roughly 1% before taxes and other changes. While the raise helps, it still falls short of fully covering the higher cost of living.
Pay adjustments vary by employer, industry, employment contract, and location. Some workers receive regular cost-of-living increases, while others go years without a raise. If employers raise pay to match higher prices, a wage-price spiral is possible, though it isn’t guaranteed.
Your personal result also depends on which expenses take up most of your budget. A pay increase may feel adequate for one household but fall short for another.
Savings and Cash Lose Value When Returns Lag Inflation
Money in a checking account, savings account, or at home can lose buying power when its return falls below inflation. When a central bank increases the money supply, more money may circulate through the economy, potentially putting upward pressure on prices. The quantity theory of money connects sustained money supply growth with rising prices when output doesn’t keep pace.
If an account earns 2% while inflation runs at 3.5%, its approximate real return is negative 1.5%. A growing money supply can also influence bank funding conditions and the yields available on savings products. The precise calculation is slightly different at higher rates, but the basic comparison is useful.
Emergency savings still need safety and quick access. You can learn more about where to keep emergency savings before considering higher-return options that may fluctuate or take longer to access.
Debt, Interest Rates, and Borrowing Can Move in Opposite Directions
Fixed-rate debt may become easier to repay in real terms because future payments use dollars with less purchasing power. A central bank may tolerate this effect when its monetary policy focuses on supporting the economy, but the monthly payment doesn’t automatically shrink.
Variable-rate credit cards, adjustable-rate loans, and new borrowing can become pricier when interest rates rise. The Federal Reserve often changes the federal funds rate during high inflation to slow spending and influence the money supply.
Those decisions affect banks, lenders, and consumers through the broader financial system. A central bank’s policy can raise borrowing costs before it meaningfully changes household prices.
As lending conditions tighten, the money supply may grow more slowly, which can reduce demand for goods and services over time. The quantity theory of money helps explain why changes in available money can affect nominal prices, loan costs, and account returns.
A central bank can also affect the real burden of existing debt when inflation reduces the value of future dollars. This doesn’t remove the need to make each payment, and a final increase in the money supply isn’t guaranteed to benefit every borrower.
How CPI Measures Inflation and Changes in Purchasing Power
The Consumer Price Index, or CPI, tracks the average change over time in prices paid for a representative basket of goods and services. Because prices affect what each dollar can buy, the CPI also shows changes in buying power.
The CPI Basket Shows Broad Price Trends, Not Your Exact Budget
The Bureau of Labor Statistics organizes the basket into categories such as housing, food, transportation, medical care, recreation, education, communication, and apparel. Each category receives a spending weight based on data from the Consumer Expenditure Surveys. BLS updates these weights as household buying patterns change.
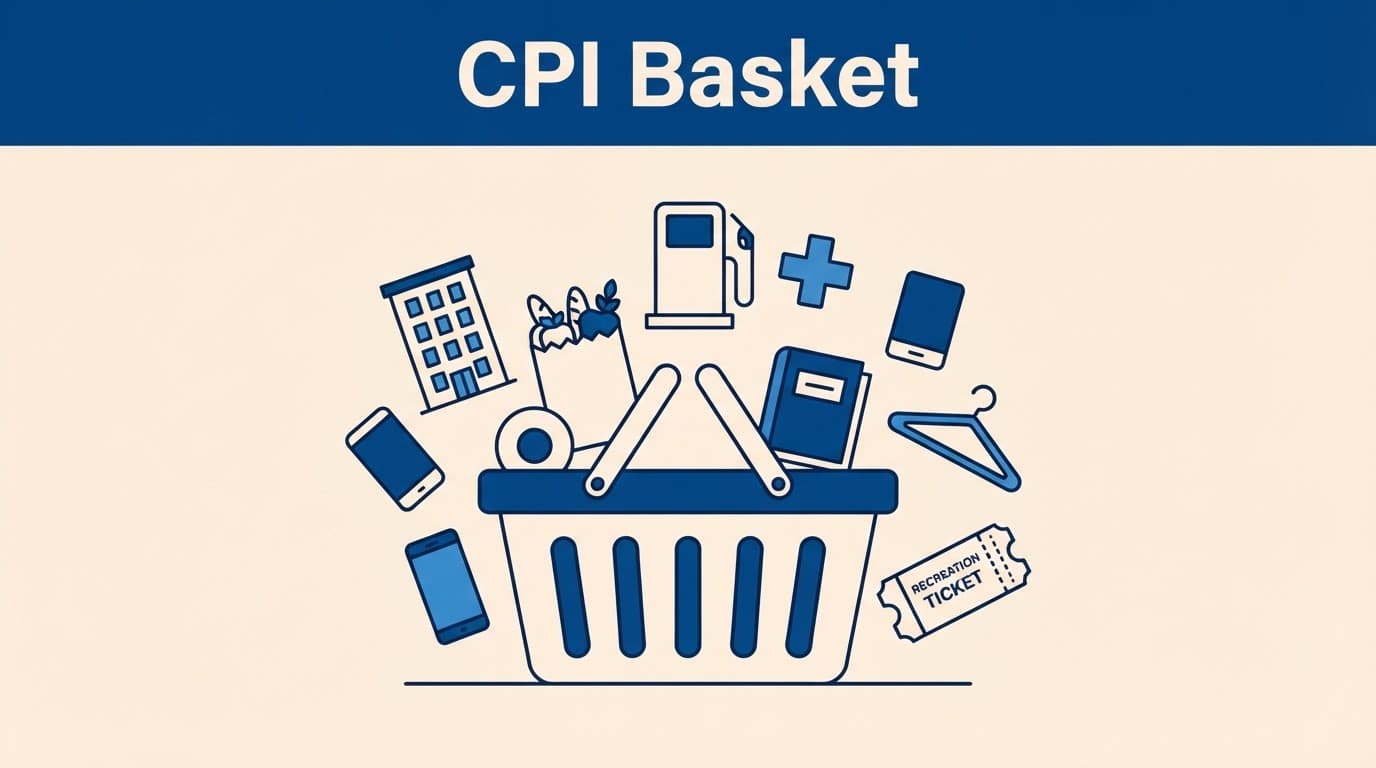
The overall CPI combines these categories into one average price index. Instead, it reflects the average price change across all items and households, not just one. Category-specific indexes, such as shelter, food, and gasoline, show what happened within one spending group. You can review the BLS CPI category data to see how individual areas contribute to the broader figure.
Your household may experience a different rate because your spending doesn’t match the average basket. A renter may feel rising housing costs more sharply than a homeowner. A driver with a long commute may notice gasoline and vehicle costs more than someone who works from home. The national CPI provides context, but your budget shows how price changes affect your own buying power.
BLS publishes several CPI measures. CPI-U, which covers all urban consumers, is the headline measure most often reported. CPI-W covers urban wage earners and clerical workers and is used in some wage and benefit adjustments. C-CPI-U accounts more closely for changes in consumer buying patterns when prices change.
Why Prices Rise and Inflation Persists
Before interpreting the data, it’s useful to understand why prices rise. Demand-pull inflation occurs when stronger aggregate demand exceeds available output. Cost-push inflation occurs when rising production costs restrict aggregate supply. These forces reflect changing supply and demand, and both can affect a broad price index.
Built-in inflation can continue after an initial shock. Workers may seek higher pay, while businesses raise prices to cover those wages. This wage-price spiral can reinforce inflation expectations, causing households and companies to expect future increases. Those expectations can support both demand-pull inflation and cost-push inflation.
The producer price index, or PPI, measures prices received by domestic producers. The PPI can signal upstream pressure before those costs reach consumers. However, businesses may absorb some increases, change suppliers, or adjust product sizes. For that reason, the producer price index doesn’t move in lockstep with CPI. A second comparison of the producer price index can help show whether pressure comes from energy, materials, or services. The producer price index also reflects producer transactions, not the final retail prices households pay.
Money Supply, Central Banks, and Inflation
Money growth is another part of the explanation. When the money supply expands faster than output, more dollars may compete for the same goods. The quantity theory of money summarizes this relationship through money, velocity, prices, and output. It is a useful framework, but not a complete forecast.
If the money supply grows while velocity remains stable, the quantity theory of money suggests that prices can rise. If output grows just as quickly, the effect may be smaller. This is why the money supply alone doesn’t determine every price movement.
A central bank uses monetary policy to influence borrowing, spending, and investment. When a central bank raises interest rates, loans may become pricier and demand may cool. The federal funds rate is one important channel for this process. In the quantity theory of money, tighter policy can slow money supply growth and reduce spending velocity.
A central bank may also respond when inflation expectations become embedded. Its monetary policy can affect the money supply through asset purchases, lending conditions, and reserve management. The quantity theory of money helps explain the long-run connection between monetary expansion and prices, while a central bank must also consider output and financial conditions.
Limits of Money Supply as an Inflation Measure
The money supply isn’t a single pool that moves evenly through the economy. Bank lending, saving, debt repayment, and payment habits all affect how quickly money circulates. The quantity theory of money therefore works best as a simplified model, not a mechanical rule.
A central bank cannot instantly expand or contract the money supply in every market. Policy also works with delays, and the quantity theory of money may miss supply disruptions or sudden changes in velocity. A central bank must weigh inflation against employment and economic growth.
The money supply can grow during periods when households save rather than spend. In that case, the quantity theory of money may predict less immediate price pressure than a basic comparison suggests. A central bank also watches credit conditions because lending can influence spending without an equal change in measured money supply.
The quantity theory of money doesn’t explain every short-term movement in the money supply. It also can’t identify which categories will rise first. A central bank therefore studies surveys, market prices, wages, and production data alongside monetary measures.
Other Factors That Influence Inflation
A final money supply example shows the model’s limits. If the money supply rises during a supply shortage, prices may increase even while output weakens. The quantity theory of money can describe the monetary pressure, but it doesn’t replace analysis of capacity, trade, or production.
Headline CPI includes all measured categories, while core inflation usually excludes food and energy because those prices can change sharply. Core inflation can provide a clearer view of persistent trends, but headline CPI still reflects actual household spending. The producer price index offers another perspective by tracking upstream prices, and a fourth reference of the producer price index can reveal cost pressure before it appears in consumer data.
Extreme outcomes use different terms. Hyperinflation means prices rise extraordinarily fast and money loses value rapidly. Deflation means the general price level falls. Stagflation combines high inflation with weak economic growth, while a second form of stagflation can involve rising unemployment and a third can follow a supply shock. These outcomes show why inflation can coexist with weak economic growth.
How to Read an Inflation Rate Without Getting Confused
A month-over-month inflation rate compares prices with the previous month. A year-over-year inflation rate compares prices with the same month one year earlier. Monthly results can move sharply because of fuel prices, seasonal demand, or economic cycles, while annual changes usually provide a broader view.
When annual inflation is 3%, prices in the measured basket are about 3% higher than a year earlier. That doesn’t mean every item rose exactly 3%. Rent could rise faster, while another category stays flat or becomes cheaper.
The CPI index uses a reference base. For most CPI-U and CPI-W series, the average price level from 1982 to 1984 equals 100. An index reading of 107 means the measured price level is 7% above that base period.
For historical comparisons, use the BLS CPI Inflation Calculator. The calculator generally uses annual average CPI-U values, so it compares average yearly buying power rather than the price of one specific item in one particular month.
Why Inflation Data May Not Match What You See at the Store
CPI is an average, while your receipts reflect your exact purchases. Prices also change at different speeds. Gasoline can swing within weeks, whereas rent and many service prices may adjust less often.
Monthly data, annual averages, seasonal patterns, product substitutions, and regional price differences can all affect comparisons. A sale, a smaller package, a different brand, or a new model may change your spending even when the category index moves modestly.
A national measure is a useful guide, but your personal experience depends on what you buy most often. The goal of monetary policy is price stability, not identical prices for every household.
Practical Ways to Protect Your Finances During Inflation
Everyday choices, not just economic headlines, connect inflation and purchasing power. As prices rise, review your spending, protect accessible savings, reduce expensive debt, and judge investments by their inflation-adjusted results.
Review Your Budget and Protect Essential Spending
Start with your actual spending, not your memory or an old budget. Review several recent bank and credit card statements, then compare current costs with earlier months. Which categories increased the most? Groceries, rent, insurance, utilities, and transportation may need closer attention than small discretionary purchases.
Track the inflation rate alongside your household cost of living, but focus on your spending patterns. A national measure may not reflect the prices that most affect your budget.
Separate needs from wants, but avoid treating every need as fixed. You may still need groceries, yet you can compare prices, choose store brands when quality is acceptable, plan meals, and use food before it expires. Reducing waste can lower the cost of the same meals without cutting nutrition.
Recurring expenses also deserve a review. Cancel subscriptions you no longer use, compare insurance premiums at renewal, and check whether fees or service prices have changed. A monthly budgeting guide can help you organize these reviews.
Your budget is a working map, not a document you create once and ignore. Update categories as prices change, while protecting savings contributions when your cash flow allows. Even a smaller automatic transfer helps you stay in the habit and helps your future goals keep up with rising costs.

Keep Emergency Money Safe, Available, and Earning a Fair Rate
Emergency savings should prioritize safety and access over high returns. You may need this money for a job loss, medical bill, or urgent repair, so putting it in a volatile investment can create a problem when the cash is needed.
Compare insured savings accounts, money market deposit accounts, and certificates of deposit based on access rules, penalties, and interest rates. A central bank can influence deposit yields through policy decisions that affect the money supply. Changes in the money supply can also alter the rates banks offer savers. These shifts matter for economic stability, but FDIC insurance generally provides the more immediate protection against bank failure.
The FDIC generally insures qualifying deposits up to $250,000 per depositor, per insured bank, per ownership category. However, FDIC insurance protects the account from bank failure, not from inflation reducing its buying power.
Rates change, so check whether your account remains competitive among available alternatives. After using emergency savings, rebuild it as soon as your budget permits. Also raise your target when essential monthly expenses increase. Guidance from the Consumer Financial Protection Bureau on emergency savings supports regular, automatic transfers.
Manage High-Cost Debt Before It Becomes More Expensive
Review credit card balances, variable-rate loans, and other costly debt before inflation and rising interest rates squeeze your budget further. The Federal Reserve may tighten policy to support price stability, which can raise borrowing costs. Monetary policy can also affect the money supply and the terms lenders offer. Paying more than the minimum, even when you can’t eliminate a balance immediately, reduces interest charges and shortens repayment time.
Avoid new high-interest borrowing for routine expenses. If consolidation or refinancing could help, compare the total cost, fees, promotional period, rate changes, and repayment term. A lower monthly payment may still cost more overall if the loan lasts longer.
Fixed-rate debt keeps the same scheduled interest rate, while variable-rate debt can change as market rates move. Inflation may reduce the real burden of a fixed payment over time, but the bill still leaves your account each month. Variable-rate balances can become more expensive sooner, so please review their terms carefully. The central bank’s policy path can influence these borrowing conditions. The CFPB’s highest-interest debt payoff guidance describes a practical way to prioritize repayment.
Think About Real Returns When Choosing Investments
A real return is investment growth after inflation. If an account earns 4% and the inflation rate is 3%, the approximate real return is 1% before taxes and fees. That result may not preserve your buying power if taxes and costs reduce it further.
Cash and bonds can provide stability, but their returns may fall behind rising prices. Investors watch how a central bank manages the money supply because policy changes can affect asset prices and yields. Changes in the money supply can also influence inflation expectations before consumer prices fully respond. Rising production costs may create additional pressure across markets.
Stocks, real estate, and other assets may offer long-term growth potential, yet each carries risk and none guarantees inflation protection. During stagflation, investors may face weak growth alongside elevated prices, so no single asset is dependable in every environment.
Use a time-based plan, diversify across appropriate assets, and review fees and taxes. The SEC’s guidance on investment fees explains how ongoing costs reduce returns over time. Avoid changing your entire portfolio because of one recent inflation report. This information is general education, not individualized investment advice.
Key Takeaways About Inflation and Purchasing Power
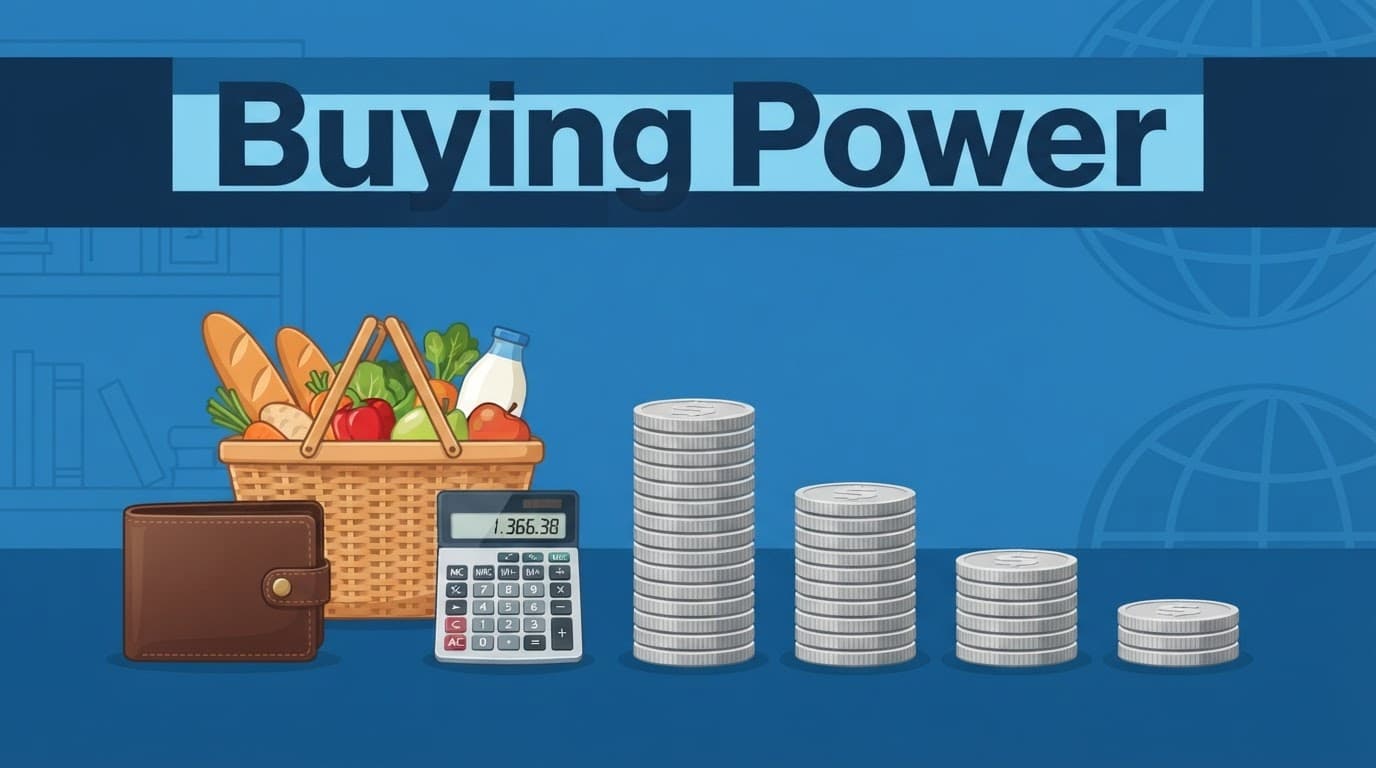
Inflation and purchasing power are two sides of the same financial equation. When average prices rise, each dollar buys less. A 3% inflation rate may seem modest, but repeated increases can reduce how far your income, savings, and investments go.
When a central bank expands the money supply faster than the economy can absorb it, prices may rise. Hyperinflation means an extreme price surge, deflation means falling prices, and stagflation combines high inflation with weak growth.
The Main Points to Remember
- Inflation raises average prices over time. At 3% annually, a $100 item would cost about $134.39 after 10 years because the increases compound.
- Buying power shows what money can purchase. A $100 balance remains $100 in nominal terms, but its real value falls as prices rise. The Bureau of Labor Statistics explains how the purchasing power of the dollar changes over time.
- Inflation affects households differently. National figures average many goods and services, while your personal costs depend on housing, food, transportation, health care, and education.
- Real income matters more than a larger paycheck. Nominal income is your dollar earnings. Real income adjusts for inflation and shows whether your pay can buy more or less.
- Real returns matter when you save and invest. A 4% return during 3% inflation produces an approximate 1% real return before taxes and fees.
- Borrowing costs can change the impact of inflation. Fixed-rate debt may become easier to repay in real terms, while variable-rate debt can become more expensive as lenders adjust rates.
A Practical Inflation Checklist
Use these steps when rising prices begin to pressure your finances:
- Review your budget and compare current expenses with earlier statements. Focus on essential categories that increased the most.
- Keep emergency savings in a safe, accessible account, and check whether its yield remains competitive.
- Manage expensive debt, especially credit card balances and variable-rate loans. Paying down high-interest debt can protect more of your income.
- Compare wage growth and savings returns with the inflation rate, not just with last year’s dollar amounts.
- Monitor economic conditions, including how the central bank manages the money supply. These broader changes can affect prices, borrowing costs, and investment returns.
- Make long-term financial choices based on your goals, time horizon, and ability to accept risk.
The consumer price index is a useful measure of broad price movement, but it isn’t a personal cost-of-living report. Review current CPI data from the BLS for national trends, then use your spending records to understand how inflation affects your purchasing power. A central bank can influence the money supply, but it can’t eliminate every household’s exposure to rising prices.
Frequently Asked Questions
What is inflation?
Inflation is a broad increase in the prices of goods and services over time. As prices rise, each dollar loses purchasing power and buys fewer goods and services.
How does inflation affect purchasing power?
Inflation reduces purchasing power because the same amount of money covers less than it did before. For example, if prices rise 3% each year, $100 will buy about $74.41 worth of today’s goods after 10 years.
Why might my personal inflation rate differ from the national rate?
The published inflation rate reflects an average basket of consumer expenses, while your household has its own spending pattern. Housing, food, transportation, health care, and education costs may rise at different speeds, causing your personal cost of living to change more or less than the national average.
How can I protect my finances from inflation?
Review your budget, keep emergency savings safe and accessible, manage high-cost debt, and compare income and investment returns with the inflation rate. Focus on real returns after inflation, taxes, and fees rather than relying solely on nominal dollar amounts.
Conclusion
Inflation can make familiar expenses feel heavier even when your bank balance and paycheck rise. As prices increase, each dollar buys less, so the clearest measure of progress is your money’s real value, not its nominal balance. The CPI helps you compare broad price changes with your spending, while your household budget shows how inflation affects you personally.
Keep monitoring essential expenses, reviewing income growth, and checking whether your savings returns keep pace with rising prices. A clear budgeting plan for beginners can help you make steady adjustments instead of reacting emotionally to every price change. No single product or strategy eliminates inflation risk, so focus on decisions that fit your goals, time frame, and ability to handle market changes. Understanding inflation and purchasing power helps you see what your money can truly do, then adjust your financial habits before small losses in buying power become a larger strain.