In This Article
A forex chart records how one currency has moved against another over time. Learning to analyze forex charts helps you spot trends, important price areas, and shifts in market momentum, but no chart can predict the next move with certainty.
Forex trading carries substantial risk. Leverage can magnify gains and losses, and rapid price moves can drain an account quickly. Never trade money needed for rent, bills, debt payments, or emergencies. Start with observation, practice, and a clear respect for risk.
Key Takeaways
- Forex charts show how currency pairs have moved, not what they must do next.
- Candlestick charts reveal open, high, low, and close prices in one view.
- Trends, support, and resistance give price action useful context.
- Indicators can support a plan, but they cannot replace judgment.
- Economic news, position size, and stop-loss rules matter as much as chart patterns.
Understand Forex Charts Before You Start Reading Them
A forex chart tracks a currency pair, such as EUR/USD. The first currency is the base currency, while the second is the quote currency. In EUR/USD, the euro is the base currency and the U.S. dollar is the quote currency.
The pair’s price shows how many units of the quote currency are needed to buy one unit of the base currency. When the EUR/USD rises, the euro has strengthened against the dollar, the dollar has weakened against the euro, or both are true.
Forex prices often move in pips, which are small standardized price changes. Your trading platform also shows a bid price, which is what buyers pay, and an ask price, which is what sellers request. The gap between them is the spread.
Short-term currency trading differs from long-term investing. A forex trade may last minutes, days, or weeks, while stock investing often centers on owning a business over years. Readers building basic investment knowledge may also want to review how to invest in stocks for beginners before comparing the two approaches.
Other volatile markets have their own risks. Readers researching cryptocurrency can also learn how to buy Bitcoin on Cash App, while remembering that crypto and currency markets react to different forces.
Choose the Right Chart Type for the Question You Are Asking
Line charts connect closing prices, so they make broad direction easy to see. Bar charts show the open, high, low, and close for each period. Candlestick charts display the same information in a more visual form.
Most beginners find candles easier to read because price strength and hesitation stand out quickly. Still, the chart type does not change the market’s uncertainty. The CFTC glossary definition of technical analysis also describes chart-based methods as ways to study price trends, not guarantees of future outcomes.
Set a Timeframe That Matches Your Trading Plan
A one-minute chart can look active and noisy, while a daily chart may show a steady trend. The same pair can appear bullish on a four-hour chart and bearish on a weekly chart.
Match the timeframe to your intended holding period. If you plan to hold a position for several days, a one-minute chart should not control every decision. Avoid jumping between timeframes until you find a picture that confirms what you hoped to see.
How to analyze forex charts step by step
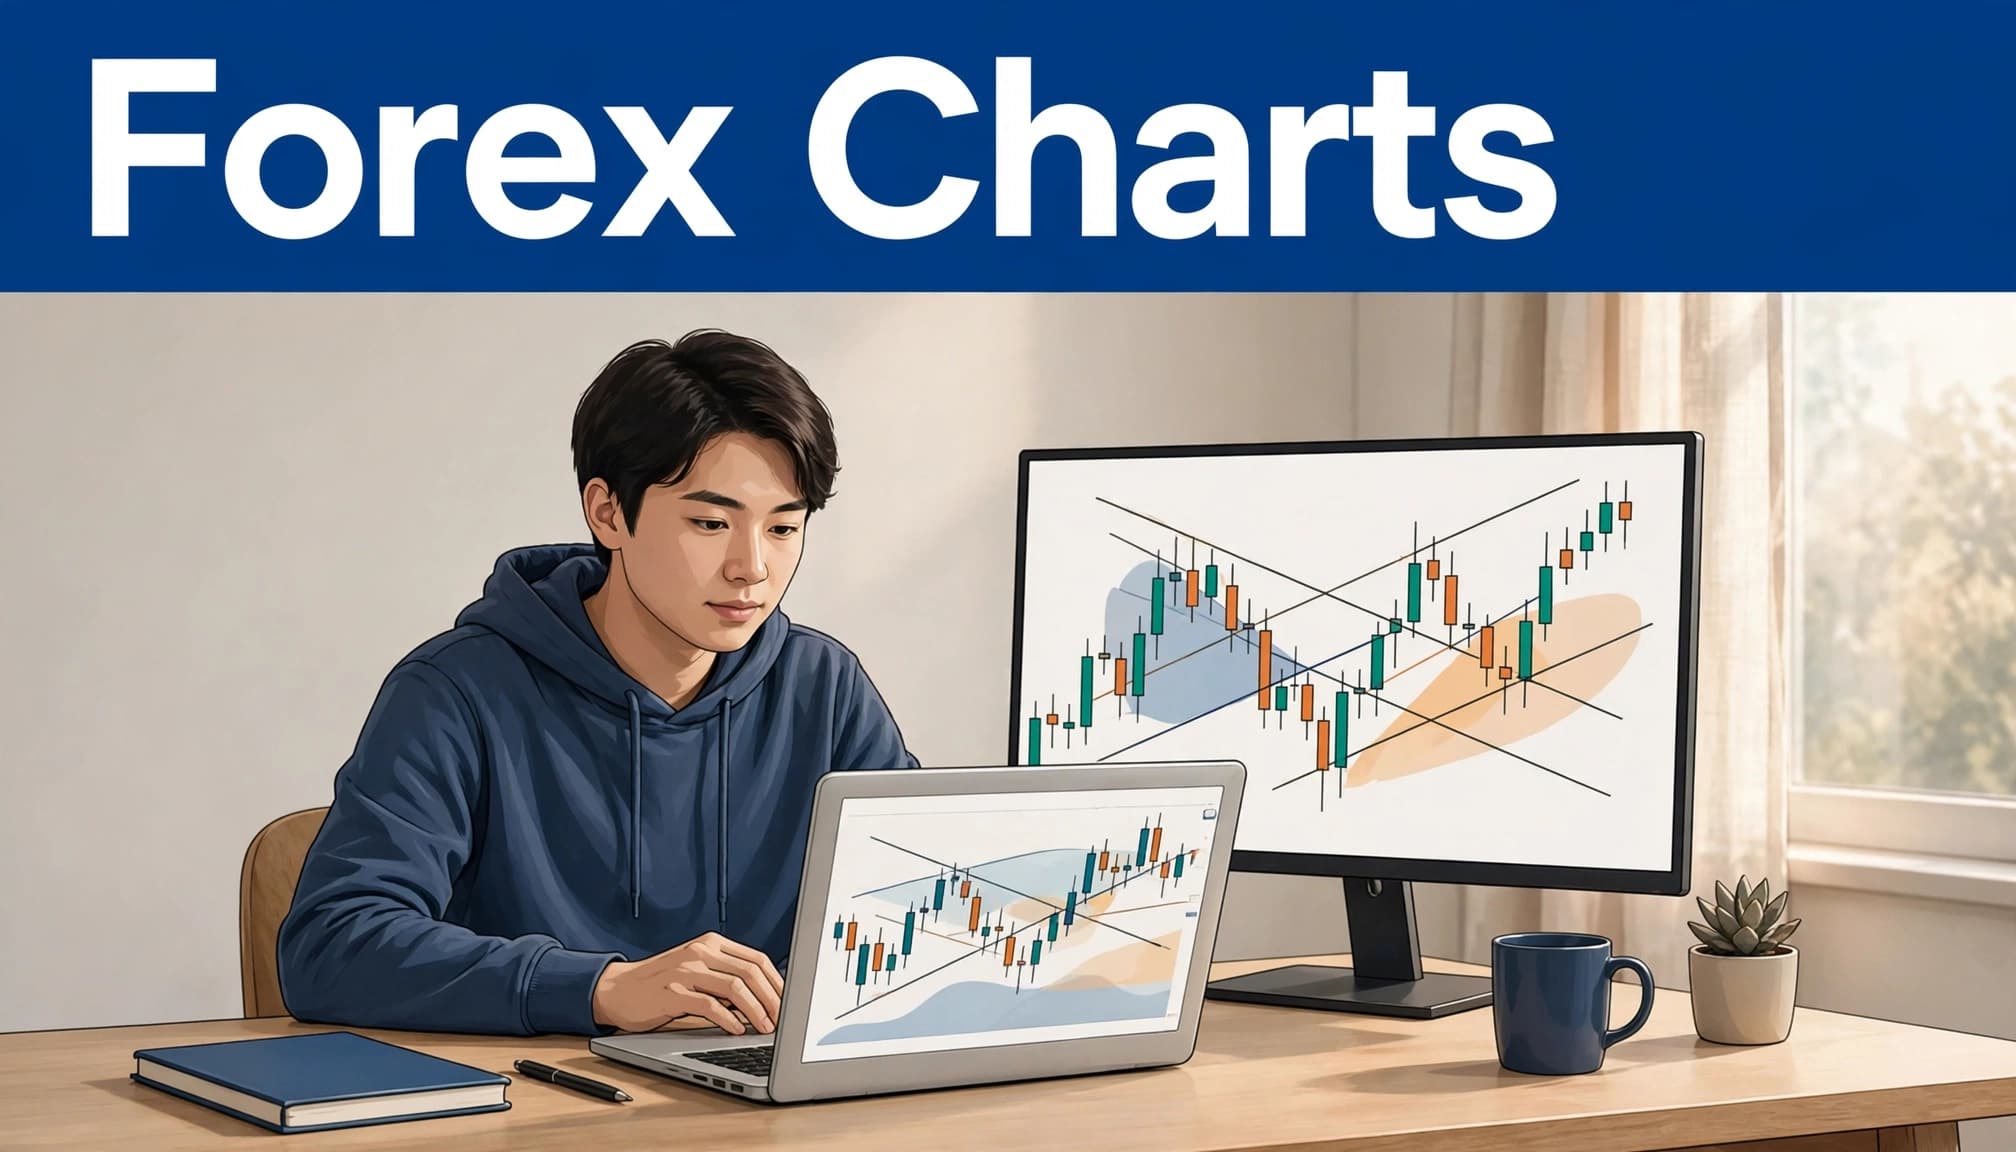
A useful chart-reading routine starts with the overall trend and then focuses on smaller details. First, look at a higher timeframe and ask whether the price is generally rising, falling, or moving sideways. Then mark important highs, lows, and areas where price repeatedly changed direction.
Next, inspect current price action near those areas. A chart is evidence, not a promise. It can show where buyers and sellers have fought before, yet it cannot tell you who will win the next round.
When you analyze forex charts, write down what would support your idea and what would disprove it. For instance, a trader observing an uptrend may identify a recent swing low as an invalidation point. That turns a vague opinion into a testable scenario.
Read Candlesticks Through Open, High, Low, and Close
Every candlestick contains four prices: open, high, low, and close. Its body shows the distance between the open and close. The upper and lower wicks show the highest and lowest prices reached during that period.
A bullish candle closes above its open, while a bearish candle closes below its open. Long bodies can show strong buying or selling pressure. Small bodies may show hesitation. A long lower wick near support can suggest that buyers rejected lower prices.
One candle is rarely enough to justify a decision. Look for its location, the wider trend, nearby levels, and what the next candles do.
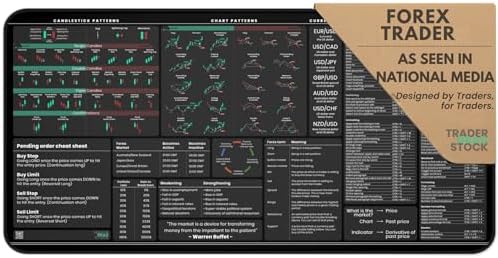
- ✔【COMPLETE FOREX TRADING GUIDE】- Features 31 candlestick patterns, 22 chart formations, major currency pairs (USD/CAD, U…
- ✔【PRODUCTIVITY SHORTCUTS INCLUDED】- Includes 55 Excel and 52 Word keyboard shortcuts to streamline forex trading workflo…
- ✔【FOREX MARKET EDUCATION】- Comprehensive guide covering forex terminology, currency pair explanations, market sessions, …
Identify Uptrends, Downtrends, and Sideways Markets
An uptrend creates higher highs and higher lows. A downtrend creates lower highs and lower lows. A sideways market stays contained between a rough floor and ceiling.
Trendlines can connect several meaningful swing points and help organize the chart. However, don’t force a line through every move. Price usually moves in a messy, non-diagonal way.
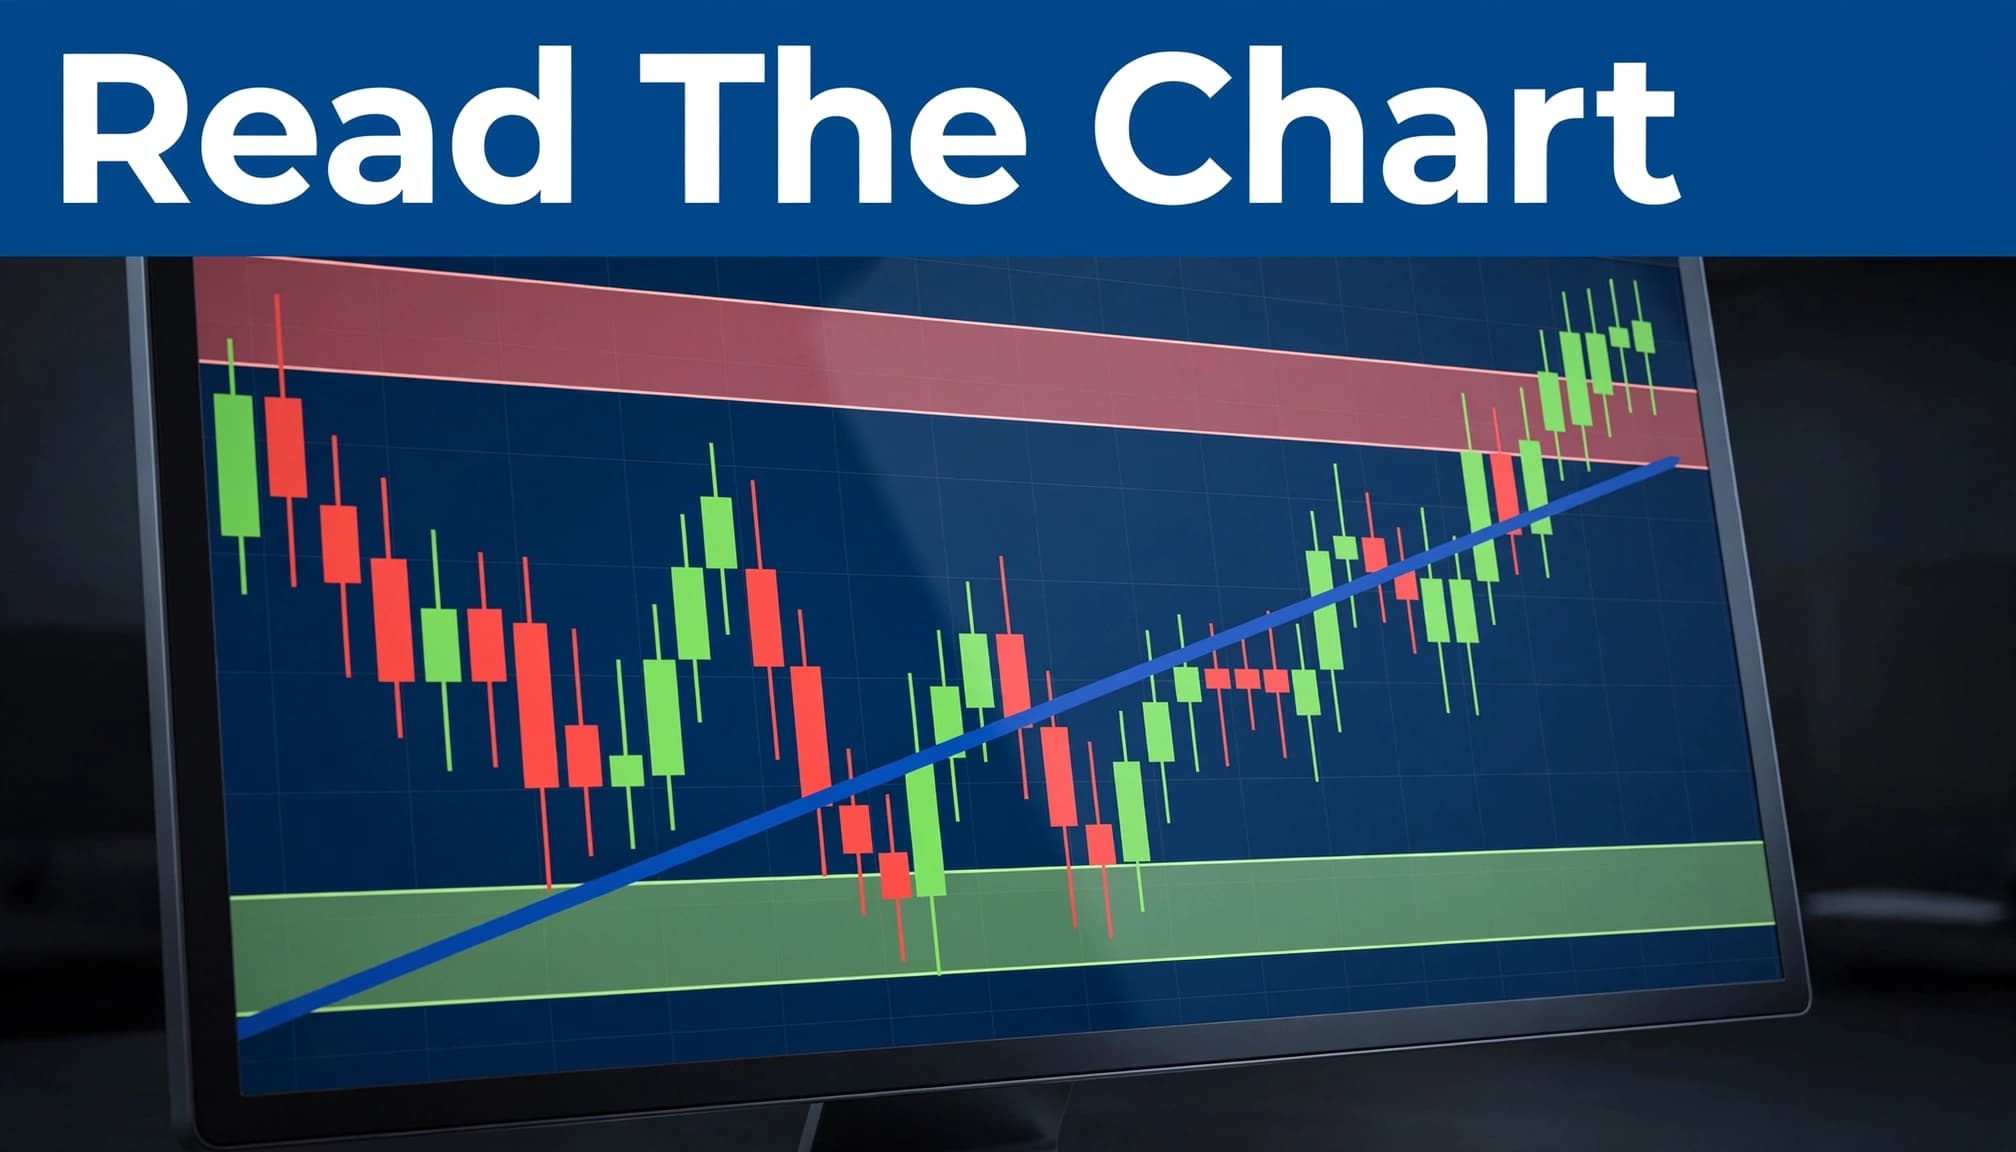
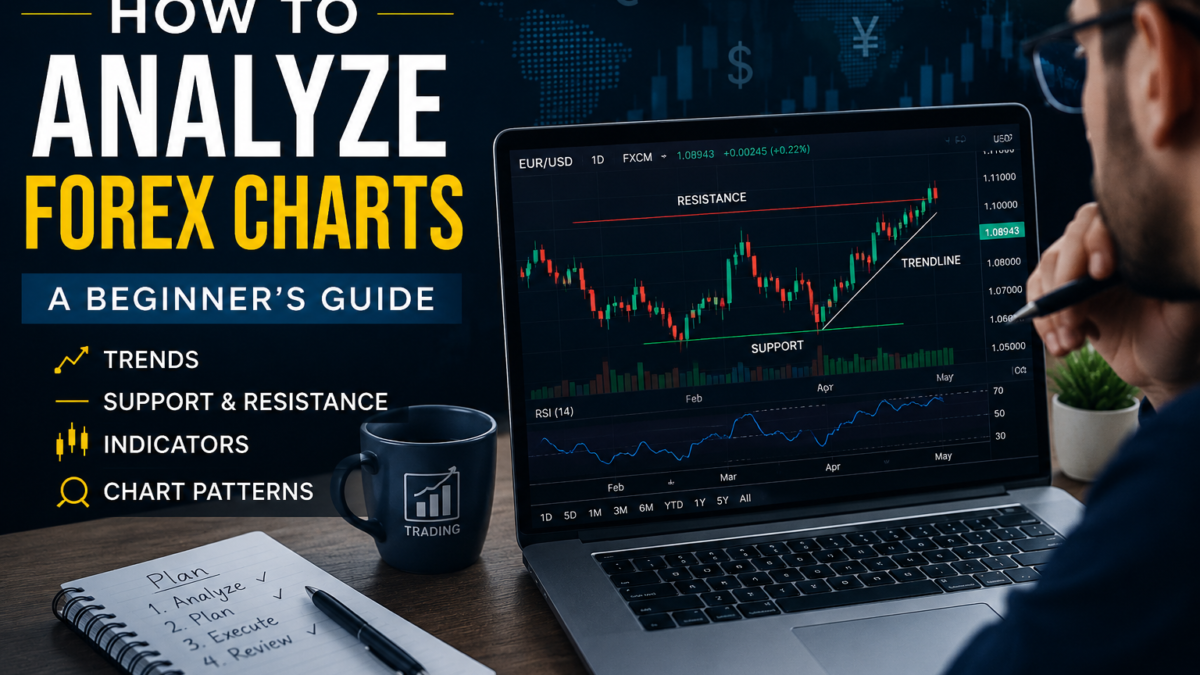
Analyze forex charts with support, resistance, and indicators.
Support is an area where buying interest has previously appeared. Resistance is an area where selling interest has previously appeared. These are zones, not razor-thin lines, because price often turns within a small range.
Prior highs, prior lows, repeated reactions, and round numbers can help identify these areas. A breakout above resistance may continue higher, but it can also fail and fall back into the range. That is why confirmation matters.
Use Moving Averages to See Direction More Clearly
Moving averages smooth past price data into a single line. They can help you see whether the price is generally above, below, or crossing a recent average. In a clean trend, that context can be useful.
Choppy markets create frequent crossings and mixed signals. No moving-average setting works best in every pair or timeframe. A crossover is one piece of evidence, not a trade instruction.
Read RSI and MACD Without Overcomplicating the Chart
RSI measures recent momentum. Traders often watch it for strong or weak price movement, including readings described as overbought or oversold. Yet an overbought market can keep rising, and an oversold market can keep falling.
MACD compares moving averages to show momentum and trend changes. Keep your screen simple while learning. One trend tool and one momentum tool are usually enough.
Strong momentum can keep an indicator at an extreme reading longer than a beginner expects, especially during a sustained trend.
Analyze forex charts with patterns, news, and risk controls.
Patterns can organize what you see, but they cannot forecast currency prices with certainty. A double top may show repeated selling near a high. A double bottom may show buyers defending a low. Head-and-shoulders formations, triangles, and flags can also describe periods of pressure and pause.
Wait for confirmation through price behavior or a breakout. Every pattern can fail. Past patterns cannot guarantee future results.
Combine Multiple Timeframes With Economic Context
A top-down view can reduce confusion. Start with a higher timeframe for the broader trend, then use a lower timeframe to watch the price near a key level. This approach helps you avoid treating a small candle as proof that a larger trend has changed.
Charts also react to economic news. Central-bank rate decisions, inflation reports, employment data, GDP releases, elections, and geopolitical events can move currencies sharply. During major releases, ordinary chart signals may become less reliable.
The CFTC’s retail forex risk disclosure guidance stresses that off-exchange foreign currency transactions involve significant risks. Technical analysis should never sit apart from market-moving developments.
Protect Your Account With Basic Risk Management
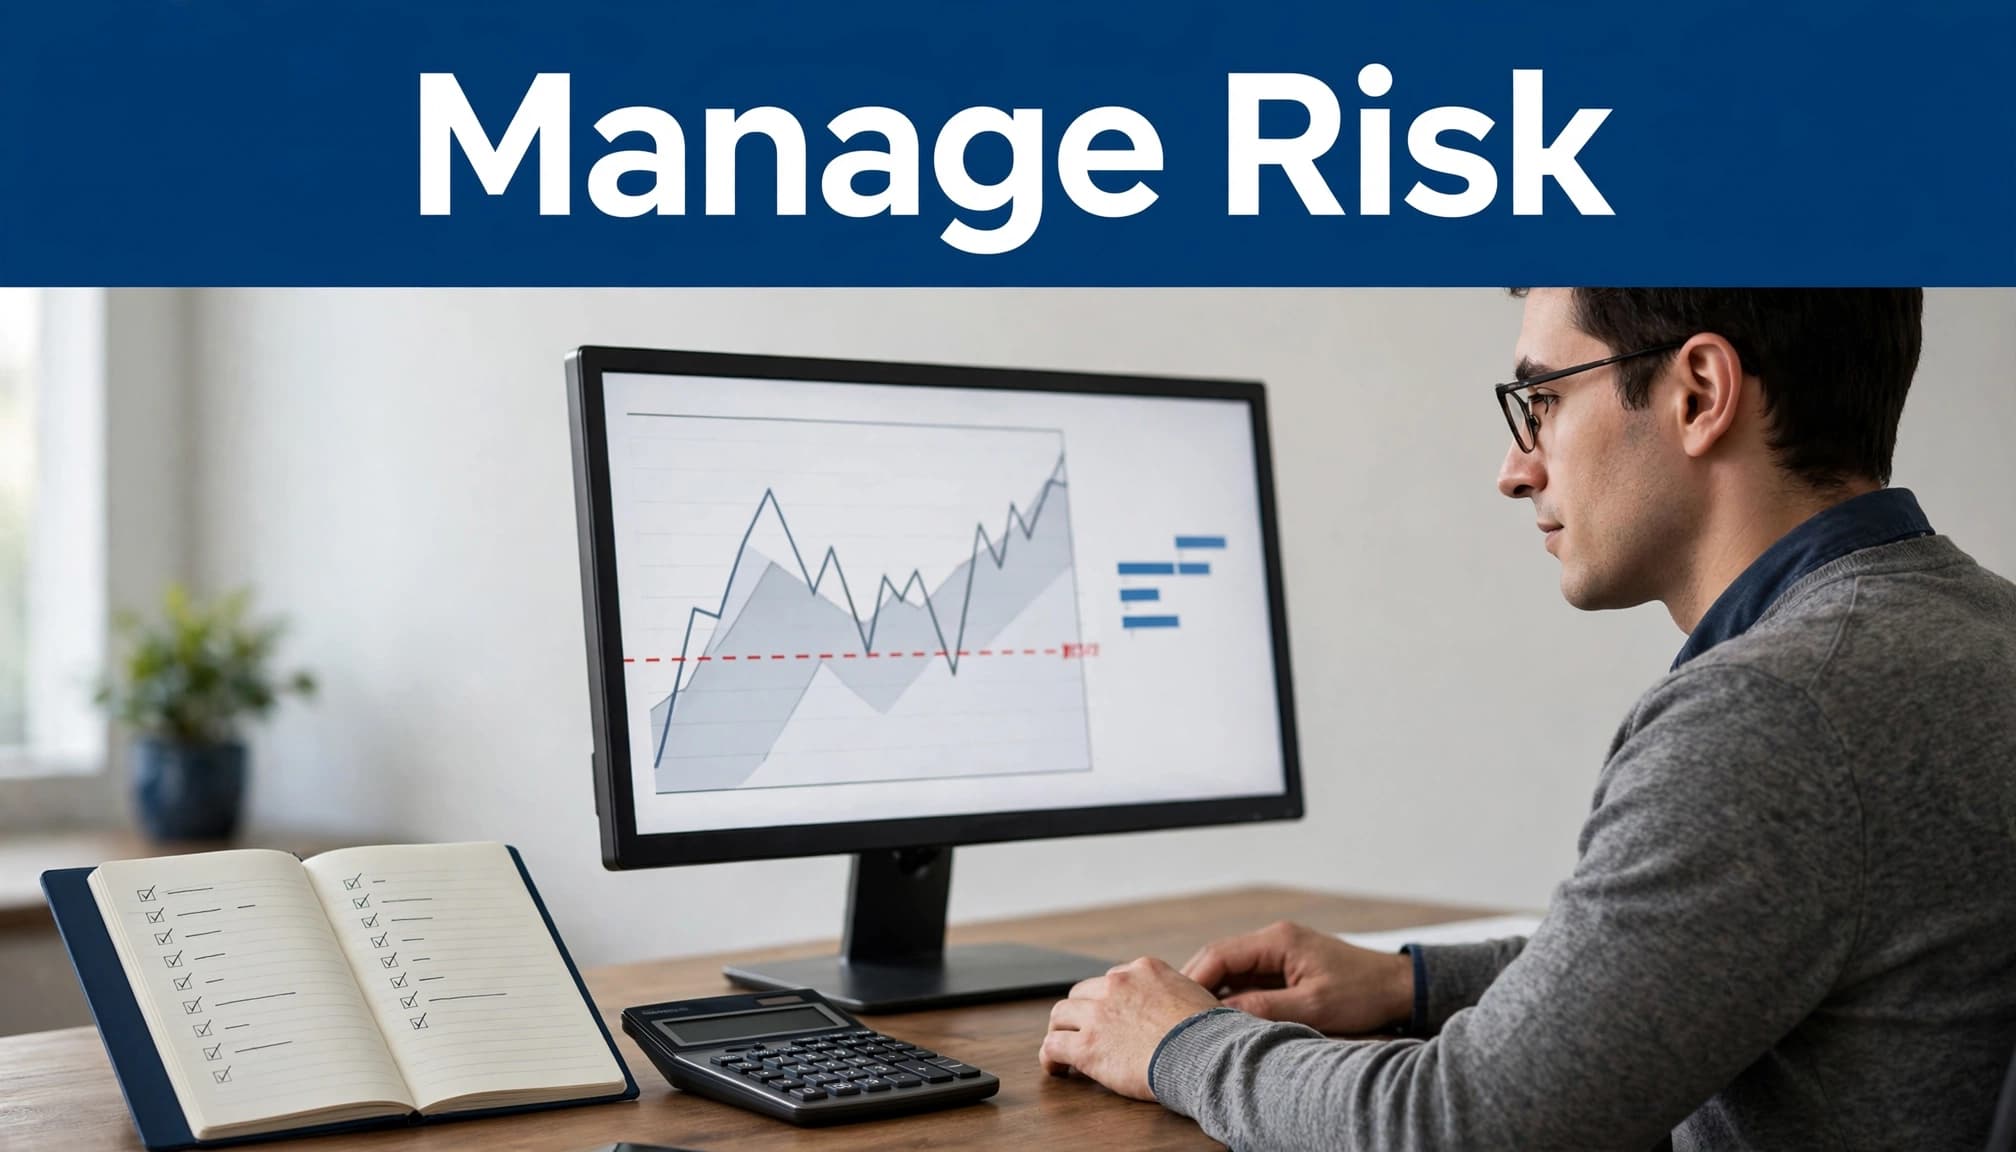
A stop-loss order sets a level where you plan to exit if the price moves against you. Position sizing determines how much money is exposed if that stop is reached. Both decisions should come before entering a trade.
Leverage increases your market exposure, so it magnifies losses as well as gains. Prices can move faster than expected, especially around news. Beginners should avoid risking large portions of their capital on one idea.
Before risking money in forex, focus on building an emergency fund so an unexpected expense does not depend on trading capital.
Build a Simple Forex Chart Practice Routine
When you analyze forex charts, consistency matters more than a crowded screen. Pick one or two currency pairs, choose your timeframe, and mark the current trend. Then note support, resistance, and any scheduled economic events.
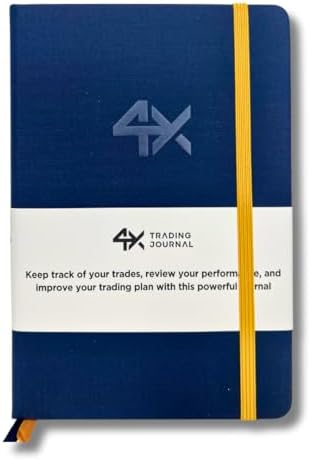
- BUILT FOR YOUR MARKET, FUTURES, STOCKS, FOREX, OPTIONS & CRYPTO: 4X is a mindset and process journal, not a strategy too…
- THE 2026 EDITION, REBUILT FROM TRADER FEEDBACK: Same trusted system, better in every way. An extra daily page for more r…
- NOT A NOTEBOOK, A COMPLETE 12-WEEK SYSTEM: Start with a one-time 9-part Trading Plan (your market, setups, risk rules an…
Write a possible scenario and an invalidation point before watching the next move. Practice on historical charts or a demo account. Don’t chase a candle after it has already surged, move stops out of fear, or rewrite your plan after every loss.
As you learn to analyze forex charts, a short trading journal can reveal patterns in your own decisions. Record why you considered a trade, what the chart showed, and whether you followed your risk rules.
Frequently Asked Questions
Is forex chart analysis enough to make a trading decision?
Charts are only one part of a careful decision process. Economic news, volatility, trading costs, trade size, and risk limits also matter. No form of analysis removes the possibility of loss.
What is the best forex chart for a beginner?
A clean candlestick chart is a strong starting point because it shows open, high, low, and close prices visually. The best timeframe depends on your plan, but beginners should avoid treating very short-term charts as the whole market.
How many indicators should a new trader use?
Keep the chart simple while you learn. One trend indicator and one momentum indicator can provide enough context. Adding several tools often produces conflicting signals and false confidence.
Can chart patterns predict currency prices?
Patterns describe past price behavior and can help create possible scenarios. They do not predict prices with certainty. Use confirmation, an invalidation point, and a risk limit before acting on any pattern.
Should beginners trade forex with leverage?
Leverage increases exposure and magnifies both gains and losses. Learn without risking essential funds, understand your broker’s terms and applicable regulations, and consider qualified financial guidance before trading.
Conclusion
To analyze forex charts well, start with the currency pair and timeframe. Then read candles, identify trends and key price zones, use only a few indicators, and check the economic calendar before making decisions.
The strongest habit is disciplined observation. Practice your process, control risk, and accept that forex trading carries significant risk. Fast results are never a substitute for careful preparation.