In This Article
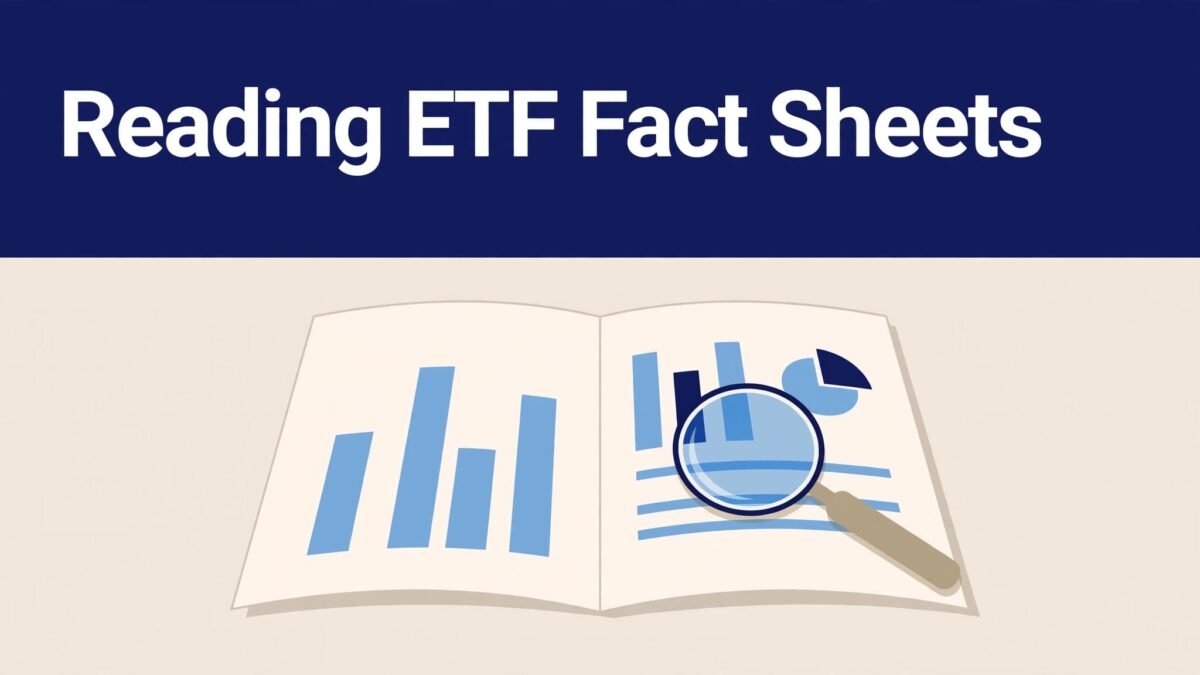
An ETF fact sheet can put dozens of numbers in front of you before it tells you what you need to know. Learning how to read an ETF fact sheet helps you find the details that matter: what the fund owns, what it costs, and how it behaves when you trade it.
Start with the fund’s goal, then inspect its holdings, fees, returns, trading details, payouts, and risks. The sheet is a useful summary, but confirm any decision-making details in the fund’s official documents before you invest.
How to read an ETF fact sheet, starting with its goal
First, check the fact sheet’s as-of date. Holdings and performance figures may reflect a month-end or quarter-end snapshot, while a fee or yield could have a different date. Then find the investment objective and the benchmark the manager uses to measure the fund.
Those two lines give you a fair starting point. A fund designed to follow U.S. stocks shouldn’t be judged against a bond index, even if the bond index had a stronger year.
How to read an ETF fact sheet begins with the fund’s objective, not its latest return.
Match the benchmark to the kind of investment you want
An ETF’s name is shorthand, not a full description of its portfolio. Check the exact index or stated strategy, then identify the asset class and market it covers. The S&P 500, for instance, focuses on large U.S. companies. A sector fund tied to energy stocks has a much narrower job.
Some ETFs seek to track an index; others use an active strategy. FINRA’s overview of exchange-traded products explains how these funds can hold baskets of stocks, bonds, and other assets. For any fund, ask whether that basket gives you the exposure you intended to buy.
Check whether the holdings match the fund’s promise
Scan the top holdings alongside sector, country, and asset-type weights. A long holdings list can create an impression of broad diversification, but a handful of large positions may still drive much of the result. Likewise, a global label may hide a substantial tilt toward one market.
For a bond ETF, look beyond issuer names. The mix of government and corporate debt, credit quality, and sensitivity to interest rates can matter more than the number of bonds listed. If the fact sheet shows only the largest positions, check the fund website for a fuller, more recent holdings list.
Compare ETF fees and performance without chasing returns
Costs deserve attention because an ETF must earn them back before an investor benefits. Returns need context, too: compare the fund with its stated benchmark over several periods rather than choosing the fund with the most impressive recent number.
Read the expense ratio and look for fee waivers
The expense ratio is the fund’s annual operating costs expressed as a percentage of its assets. A 0.20% ratio works out to roughly $20 a year on a $10,000 holding if the holding’s value stays unchanged. The fund deducts expenses from its assets; you typically won’t see a separate charge for them on a brokerage statement.
Check whether the fact sheet lists a gross expense ratio, a net ratio, or both. A net figure may reflect a fee waiver or expense cap. Read the terms in the prospectus, including when an arrangement may end. The SEC’s ETF investor bulletin is a useful companion when reviewing fund costs and disclosures.
If you’re also deciding which fund structure suits you, the distinction to keep in mind is how shares change hands: an ETF trades on an exchange, while a traditional index mutual fund follows different buying and redemption procedures.
Compare returns with the benchmark over several time periods
Find the one-, three-, five-, and ten-year figures where the fund has enough history. Check the dates and whether returns assume distributions were reinvested. Then compare each period with the same period for the stated benchmark.
A small gap isn’t automatically a warning sign. Fund fees, index-tracking differences, and portfolio changes can affect results. Also distinguish returns calculated using net asset value (NAV) from returns based on market prices. Your purchase and sale prices determine what you actually receive.
Past performance doesn’t predict future results. A short winning streak says little about whether an ETF meets your long-term goal. If a fund repeatedly trails its benchmark by more than its stated costs seem to explain, examine its strategy and disclosures more closely.
Understand an ETF’s trading costs, price, and payouts
ETF shares trade on an exchange during market hours. That gives you control over when you place an order, but the price you pay can differ from the value of the fund’s underlying assets. Distributions also affect what you receive while you hold the fund.
Check the premium or discount and bid-ask spread
NAV is the value of the fund’s assets minus liabilities, divided by its outstanding shares. A share trading above NAV has a premium; one trading below NAV has a discount. As the Investor.gov ETF bulletin explains, an ETF’s market price can move away from its NAV.
The bid is what a buyer offers, while the ask is what a seller wants. The difference is the bid-ask spread. You generally buy near the ask and sell near the bid, so a narrower spread usually means less trading friction. Connecticut’s ETF consumer guidance gives a plain-language explanation of that cost.
A fact sheet may show historical premiums, discounts, or a median spread rather than today’s conditions. Check the fund website for current and historical figures before trading. A limit order can set the maximum price you’ll pay or the minimum you’ll accept, although it may not execute.
Review distributions and how often they are paid
An ETF may distribute dividends, bond interest, or capital gains. Look for the payment schedule and distribution history, especially if you’re buying the fund for income. An annualized yield isn’t a promise that future payments will match past ones.
Check how the stated yield was calculated, too. A recent payment and a yield based on a longer period can tell different stories. Depending on where you live and the type of account you use, distributions may create a tax bill even when you reinvest them.
Use the risk section to decide what to verify before investing
Risk disclosures often sound broad until you connect them to the holdings. Read the risk list beside the fund’s benchmark and portfolio weights. The exposures you’ve already found should help you identify which warnings matter most.
Connect each risk to the fund’s assets
All stock ETFs face market risk: share prices can fall. A sector ETF adds concentration risk when its holdings depend heavily on one industry. International holdings may add currency risk, since exchange-rate moves can change your return in your home currency.
Bond funds have another set of concerns. Rising interest rates generally put pressure on the prices of existing bonds, while credit risk reflects the possibility that an issuer cannot meet its obligations. Longer-duration bonds are usually more sensitive to rate changes. Liquidity risk matters when underlying securities are hard to trade, particularly during market stress.
Don’t treat a long risk list as proof that a fund is unsuitable. Use it to test whether the ETF’s exposures fit the losses and fluctuations you could tolerate.
Treat the fact sheet as a starting point, not the final check
A fact sheet compresses a fund into a few pages. For the binding details, read the prospectus, including its investment strategy, principal risks, and fee table. The latest shareholder report can add context about holdings and results.
Then visit the fund website. Confirm current holdings, fee-waiver terms, distribution information, and trading data before placing an order. These details can change after a fact sheet’s publication date. If the fact sheet and a newer official disclosure appear to disagree, resolve the difference with the fund provider rather than guessing which figure applies.
Compare ETF candidates with your own portfolio in mind
A strong fact sheet describes a fund well; it doesn’t tell you whether you need that fund. Before comparing two ETFs, decide what role the investment would play. You might need broad stock exposure, a particular type of bond holding, or income. Each goal calls for a different comparison.
Keep the candidates on equal terms:
- Compare their benchmarks and holdings first, so you’re looking at funds with similar jobs.
- Check current net and gross expenses, including the terms of any waiver.
- Put returns beside each fund’s own benchmark over matching periods.
- Review spreads, premiums or discounts, distributions, and the risks tied to each portfolio.
The cheapest ETF isn’t necessarily the lowest-cost choice for a frequent trader. A wider bid-ask spread can add to the cost of each purchase and sale. Likewise, two funds that look different by name may own many of the same companies. Adding both could increase concentration rather than diversify your portfolio.
Your time horizon matters as much as the sheet’s figures. Money you’ll need soon may not belong in a volatile stock fund, regardless of its past returns. If you’re setting that broader plan, personal finance basics for beginner investors can help you place investing alongside savings, debt, and near-term needs.
Conclusion
Knowing how to read an ETF fact sheet turns a crowded page of figures into a practical comparison. Confirm the goal and benchmark, inspect the holdings and costs, then judge returns against the right reference point.
Finally, check trading details, distributions, and the risks that follow from what the fund owns. Match those findings to your goals, and verify the key facts in current official fund documents before you invest.